Investar Mobile for NSE BSE
& nbsp;
.ņ┤ØņĢī
{
Ēī©ļö® : 0px 0px 0px 20px; line-height : normal; margin-top : 5px; margin-right : 0pt; margin-bottom : 0pt; margin-left : 10px; background-image : url (images / icon1.jpg); ļ░░Ļ▓Į ņ£äņ╣? : ņÖ╝ņ¬Į 3px; background-repeat : no-repeat;
}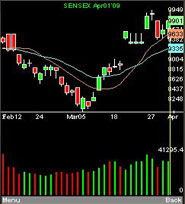
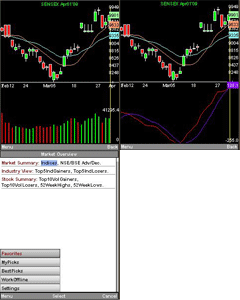
Shows Interactive Candlestick & Line chart (six month daily view) along with Indicators like EMA, SMA, RSI, Stochastics, MACD and Volume.
Splits, Dividends and Bonuses displayed in the Charts.
Shows OHLC values
Shows Pivot Lines and Resistance & Support Levels.
Allows users to Add Notes.
비슷한 애플 리케이션
코멘트 Investar Mobile for NSE BSE
장치 검색









댓글을 찾을 수 없습니다